# Debug
# Chrome Inspector
When working on GraalVM (opens new window) or a JDK with the graalvm (JVMCI) bits, start your application as:
npm start -- -Dinspect=9229
This will start a Chrome inspector debugger agent on port 9229 that you can attach for a remote debug session from your Browser.
Chrome devtools listening at port: 9229
Running: java ...
Debugger listening on port 9229.
To start debugging, open the following URL in Chrome:
    chrome-devtools://devtools/bundled/js_app.html?ws=127.0.0.1:9229/436e852b-329b5c44c3e
Server listening at: http://localhost:8080/
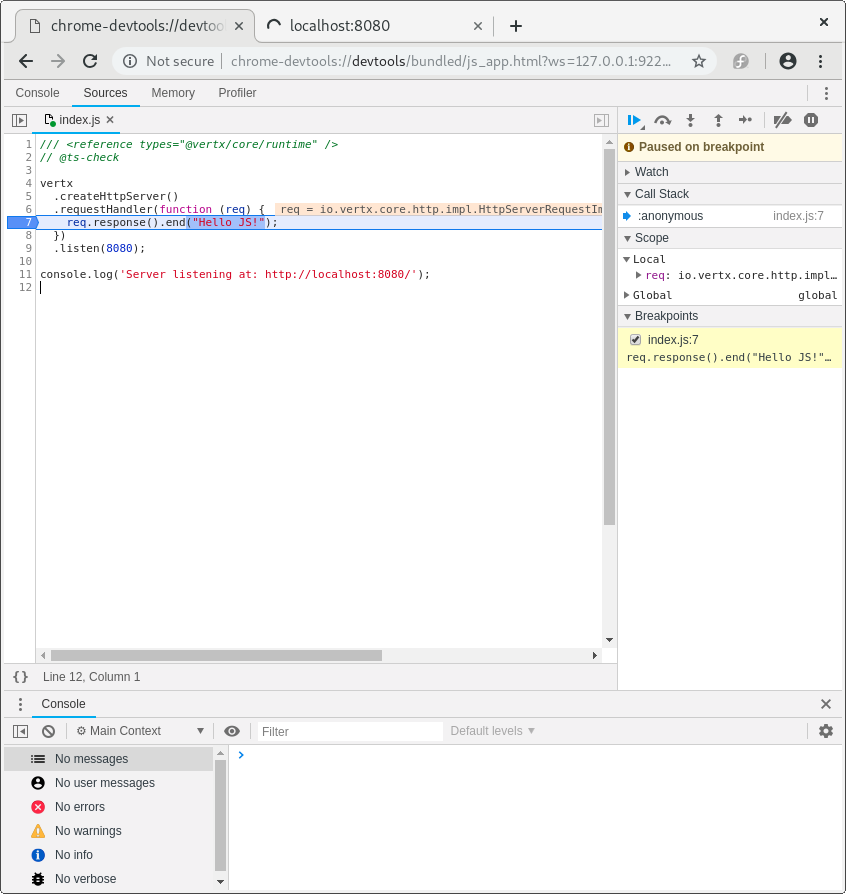
You will be able to set breakpoints, debug etc...
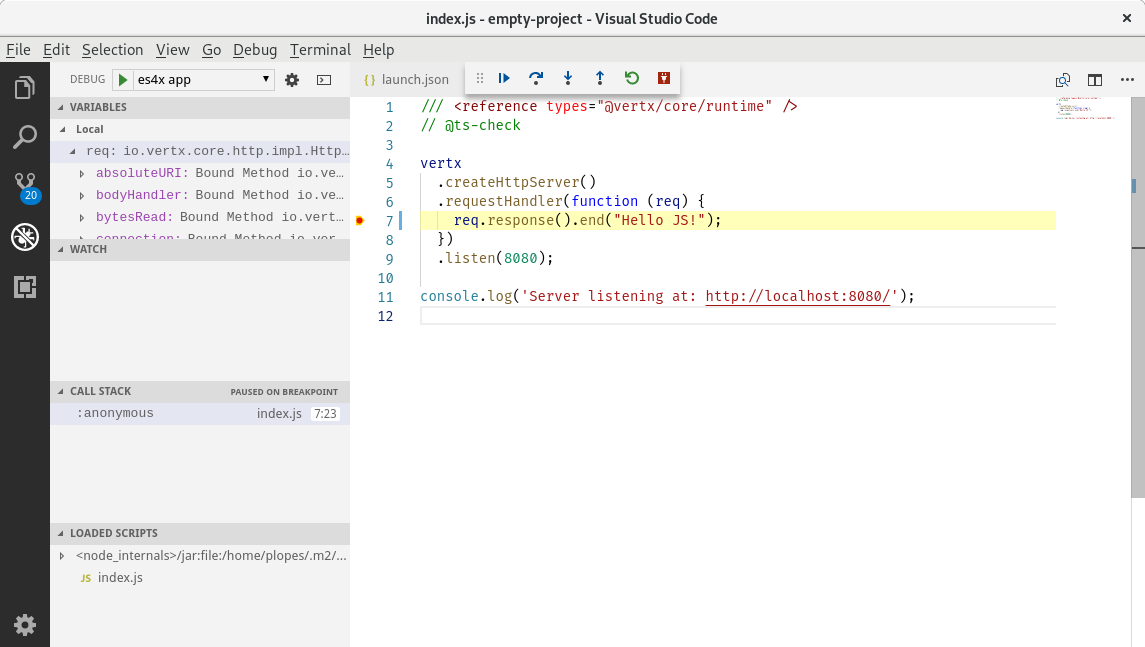
# Debug from VSCode
The usage of Chrome devtools is not a hard requirement. You can also debug the application using Visual Studio Code (opens new window).
WARNING
Before you can debug from the IDE, you need to install the extension: GraalVM Tools for Java (opens new window) and create a runner configuration.
To create the attach configuration either use the helper command, or use the template bellow:
es4x vscode
This will create a launcher.json similar to this:
{
  "version" : "0.2.0",
  "configurations" : [ {
    "name" : "Launch empty-project",
    "type" : "graalvm",
    "request" : "attach",
    "port" : 9229
  } ]
}
And attach your debugger.